

Finding a Great Short Sale
Trading from the short side is not for everyone. However, when a chart meets all of the criteria for a short position entry, there is the potential to make some serious money. The question is what to look for and how to identify the opportunity.
One of the best ways is to use an indicator that can calculate a market profile in a way that presents a range of buying and selling interest over time. The Altimeter (standalone or part of the TriggerCharts Commander Series) can do just that. Volume based price action at important levels is plotted on a chart in the form of horizontal lines. These three lines identify the highest volume traded in a specific range as well as support and resistance. In other words, you are seeing what professional traders and market participants are up to. Where they are buying and where they are selling.
Right out of the box it is programmed to clearly show the range of consolidation and where there is a potential breakout. Consolidations are when a price is between the top red line (lift or unfair high) and the green line (stall or unfair low). When the range of these expand (#1 on chart below) and then new Altimeters are plotted on the chart that are compressed (#2 and #3), traders should be ready to initiate a position.
If the price falls below the green horizontal line of an Altimeter that is compressed, after an Altimeter with a very wide range the next move can be severe. Often times the price will move back to the level seen toward the bottom of the bottom of the wide range seen previously.
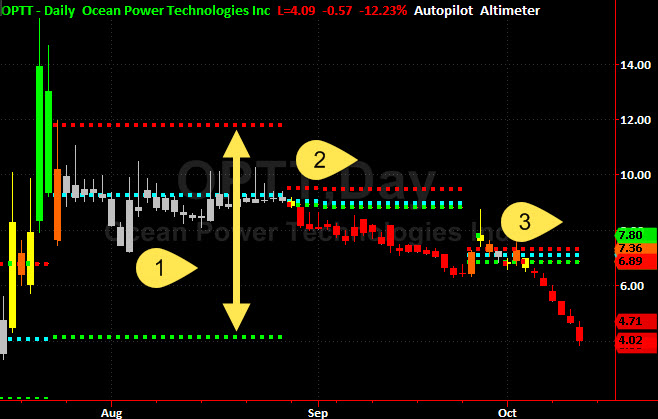
** Note – OPTT dropped another 22% on the open today **
Look Left
Scanning a chart to find breakouts (long or short) should be done by first looking at the furthest right side and then left. In doing so, Altimeters with wide ranges can be identified and then marked. As shown in the chart below, #1 is an Altimeter with a wide range for the NASDAQ 100 continuous contract (@NQ). Note that #2 and #3 have a much tighter Altimeter. Once that price broke below the green (stall) level of Altimeter#3, the short side was flashing an entry. Looking left, there is also a “hole” or fast-zone marked by #4. This occurs when there is little or no activity that has been captured by the Altimeter. Often times, holes will represent flush areas in the price that will see quick action that will move the price rapidly until it reaches the next support level.
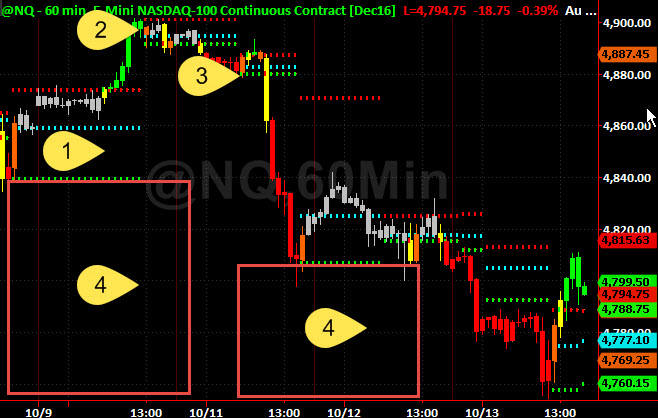
Autopilot was also added to the above charts to clearly illustrate the positioning.
(Red = Short, Green= Long, Yellow = Alert, Orange = Close)
NEW – TriggerCharts EcoTrack can be downloaded directly to your platform from the Tradestation Trading App Store.
If you want to see additional TriggerCharts indicators in action, you can check out the free video library for all of the TriggerCharts Indicators.
Take a 10-day FREE trial of any TriggerCharts premium products to see how they work!
Free Trials and More…

Commander Series Rated 5 Stars
Aileron360 adds TradeStation’s scanning capability to quickly filter hundreds of stocks, ETFs, futures and currency contracts to create trading ideas on dozens of different key conditions. From there, the RadarScreen can be used as a watchlist that will alert when conditions are prime for an entry into, or an exit out of a position.
Altimeter, Auto-Pilot and Radar can be used as either a standalone indicator or part of the TriggerCharts Commander Series for TradeStation.
You may download a free trial of any of the TriggerCharts indicators – by clicking the link below: