
Generating trading ideas can sometimes be the most difficult part in being a successful trader. One thing we have done to assist in this process is incorporating a screening function for the Aileron360 indicator. This allows users to screen for the various different alerts within the Aileron360 indicator. This includes things like levels of extremes, reversals up or down and the trigger line crossing the setup line both above and below. Once we narrow down some of these things, we can then use TriggerCharts’ Commander Series Multi-Time Frame Radar Screen and chart indicators to get further confirmation of a position that we might want to trade.
First, let’s take a look at extremes. Extreme points from the Aileron360 indicate potentially overbought or oversold areas which allow the user to take a contra-trend position. In addition, utilizing other indicators and time frames such as those from The Commander Series will help to skew the probability of profitability in your favor. This is always a good practice when seeking out trading ideas as utilizing only one indicator for a trading strategy could be flawed. Stacking up multiple indicators within multiple time frames will increase your confidence in the trade and also potentially make your trading more profitable.
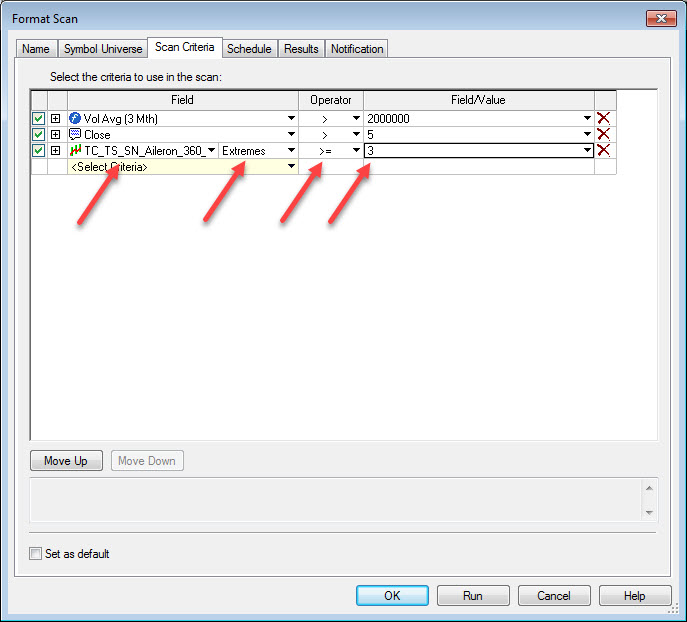
Let’s look at one example of this, screening for levels of extremes. Within the TradeStation Scanner, we first like to narrow down our trading list by only looking at stocks greater than $5 and those that trade more than 2,000,000 shares on a daily basis. This helps us filter out some of the noise that low priced and low volume stocks create. Additionally, for this exercise, we limited our stock universe to S&P 500 stocks only, however, when you go to do the screen, you can choose any list of or the whole universe of stocks to screen from. We do suggest that you try to narrow down the list however in order to reduce the amount of time the program takes to screen for ideas. Below is what this screen would look like.
(Click to Enlarge)
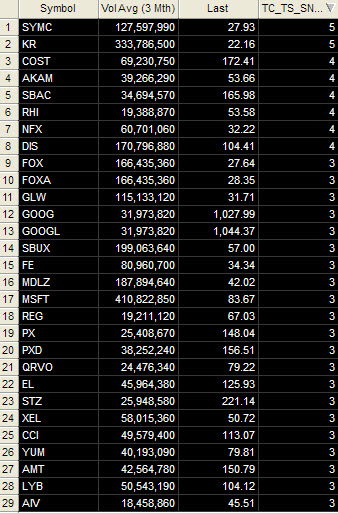
And, here are the results:
 (Click to Enlarge)
From here, we take that list and drop it into The Commander Series Multi-Time Frame RadarScreen for some quick results as to what these stocks look like on a short and longer-term time frame. We then look at the charts of each to see if something makes sense for a trade.
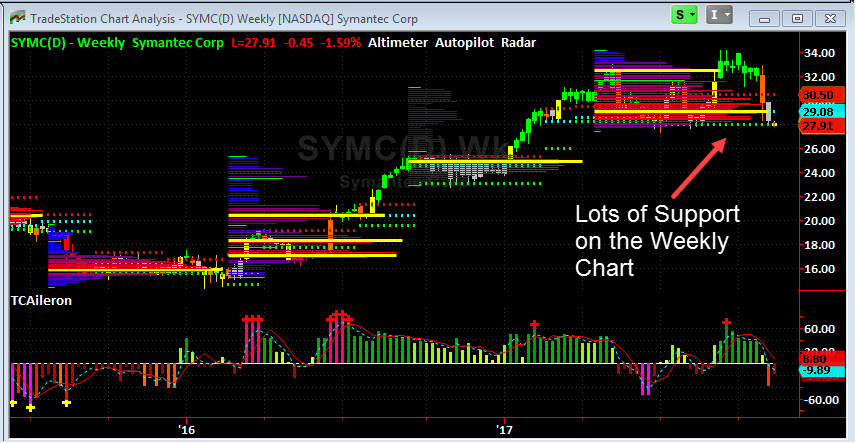
Some of the positions that standout include Akamai (AKAM), Disney (DIS), Fox (FOX), Qorvo (QRVO) and Symantec (SYMC). These standout as they are giving us multiple confirmations for a potential position. Let’s see what that means by looking at a chart of Symantec (SYMC).
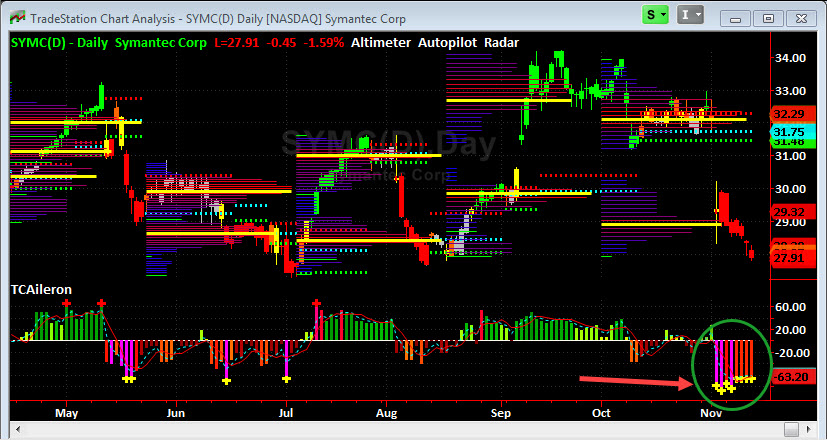
On the daily chart, we see the multiple number of extremes highlighted by a green circle within the Aileron360 indicator. This generally indicates an oversold area for the position. Additionally, when we look at the daily chart, we see quite a bit of support for the position at this particular area around $27.91. This is giving us a pretty good level to enter into this position with a limited downside stop just below $27.00 with upside potential to around $32.00 – $33.00. One should be extremely careful of this position below $27 as there is a large hole down to about $25 before new support comes into play. This is a quick example of how we might go about seeking out a position to take utilizing the Aileron360 and Commander Series indicators.